Introduction
In an era where sustainable energy is the key to a brighter future, understanding solar consumption is more critical than ever. At Data BI LLC, we are excited to unveil our latest tool – the Solar Consumption Report Dashboard, designed to shed light on the world’s solar energy landscape. This case study explores how our innovative dashboard empowers individuals, businesses, and governments to make informed decisions in the transition to clean and renewable energy sources.
Objectives
- Develop a Comprehensive Dashboard: Create a tool that provides real-time insights into global solar energy consumption trends.
- Visualize Key Performance Indicators (KPIs): Offer a wealth of KPIs for exploring and analyzing solar consumption data in depth.
- Empower Sustainable Energy Decisions: Equip users with insights needed to drive sustainable change.
Methodology
1. Data Collection and Analysis:
- Gathered extensive data on solar energy consumption from various reliable sources.
- Analyzed data to identify key trends and patterns.
2. Dashboard Design and Development:
- Designed a user-friendly dashboard with intuitive navigation.
- Integrated visual elements like charts, graphs, and maps for better data comprehension.
3. Implementation of KPIs:
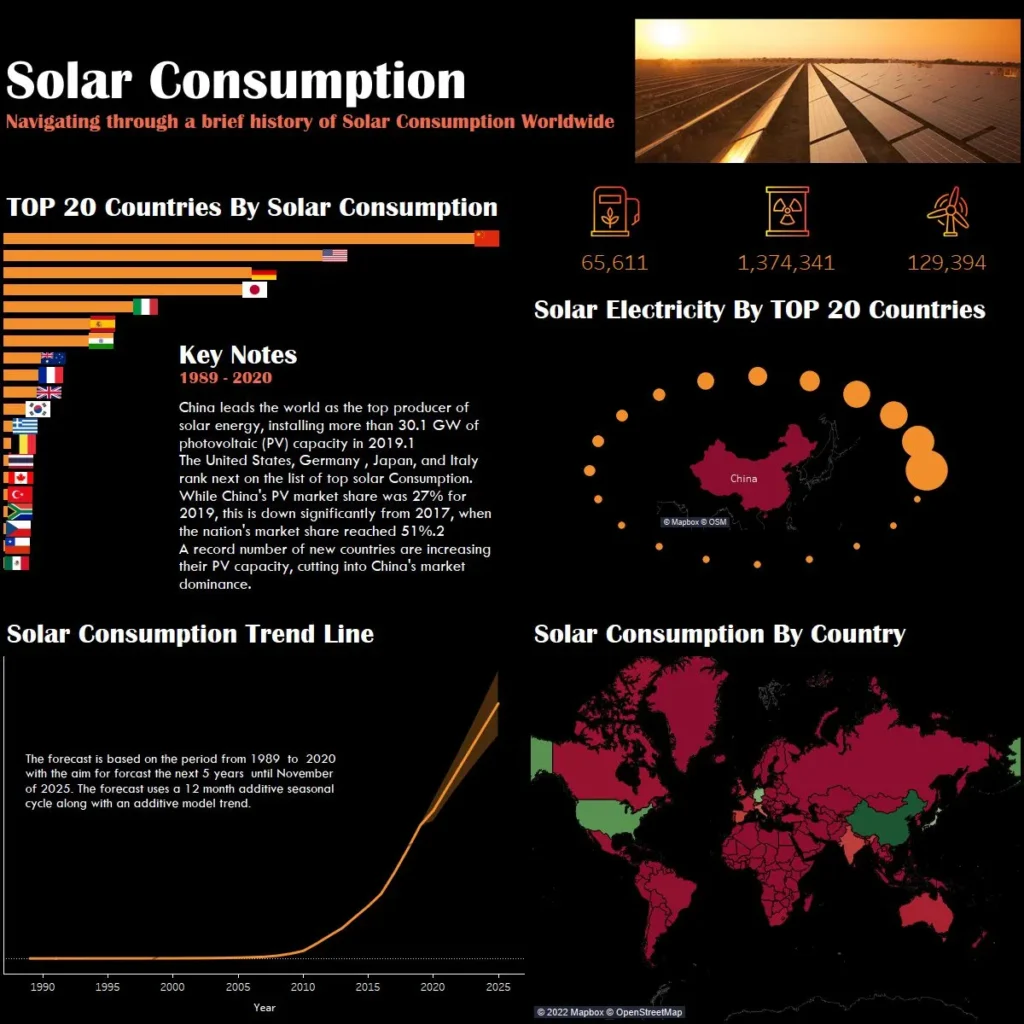
- Top 20 Countries by Solar Consumption: Identified leading nations embracing solar energy.
- Solar Electricity by Top 20 Countries: Analyzed electricity generation from solar sources in top countries.
- Solar Consumption Trend: Tracked global trends in solar energy consumption.
- Solar Consumption by Country: Explored solar energy consumption data by individual countries.
4. Testing and Optimization:
- Conducted rigorous testing to ensure data accuracy and dashboard functionality.
- Optimized the dashboard for performance and user experience.
Key Features
1. Top 20 Countries by Solar Consumption:
- Discover the leading nations in solar energy adoption.
- Insights into policy success and market dynamics.
2. Solar Electricity by Top 20 Countries:
- Compare electricity generation from solar sources.
- Foster competition and collaboration.
3. Solar Consumption Trend:
- Monitor global shifts in solar energy usage.
- Stay ahead of the curve with up-to-date trends.
4. Solar Consumption by Country:
- Drill down into specific countries to assess their solar energy journey.
- Detailed insights into national solar energy strategies.
Benefits
1. Data-Driven Decision Making:
- Empowered users to make informed decisions regarding solar energy investments and policies.
- Provided valuable insights for sustainability advocates, policymakers, and business leaders.
2. Enhanced Understanding of Solar Energy Landscape:
- Offered a clear and comprehensive view of global solar energy consumption.
- Highlighted key players and emerging markets in the solar energy sector.
3. Support for Sustainable Energy Goals:
- Facilitated the transition to clean and renewable energy sources.
- Contributed to global efforts in reducing carbon emissions and combating climate change.
Results
- Increased User Engagement: The intuitive design and comprehensive data visualization led to higher user engagement and satisfaction.
- Improved Decision Making: Users reported more informed decisions and better strategic planning based on dashboard insights.
- Positive Feedback: Received acclaim from industry experts and stakeholders for the dashboard’s accuracy and usability.
Conclusion
The Solar Consumption Report Dashboard is a testament to Data BI LLC’s commitment to driving sustainable change through data analysis and visualization. In a world where renewable energy is not just a choice but a necessity, this dashboard serves as a compass guiding users through the solar energy landscape. By making data-driven decisions, we can collectively shape a greener and more sustainable future.
Stay tuned for more updates and insights from our suite of data analysis tools. The future of clean energy is here, and it’s powered by data.
About Data BI LLC
Data BI LLC is a leading provider of data analysis and visualization services. We specialize in developing business intelligence tools, dashboards, and reports to help organizations make data-driven decisions. Our vision is to put data at the fingertips of decision-makers, empowering them to drive sustainable growth and innovation.
This case study showcases how Data BI LLC leverages advanced data visualization techniques to provide valuable insights into the solar energy sector, fostering informed decision-making and promoting sustainability.