In the world of sales, data is the driving force behind informed decisions and revenue growth. At Data Bi, we understand the importance of data-driven insights in optimizing sales performance. Today, we are thrilled to introduce our Sales Data Analytics Dashboard, meticulously crafted using Power BI.
Unlocking the Power of Sales Data
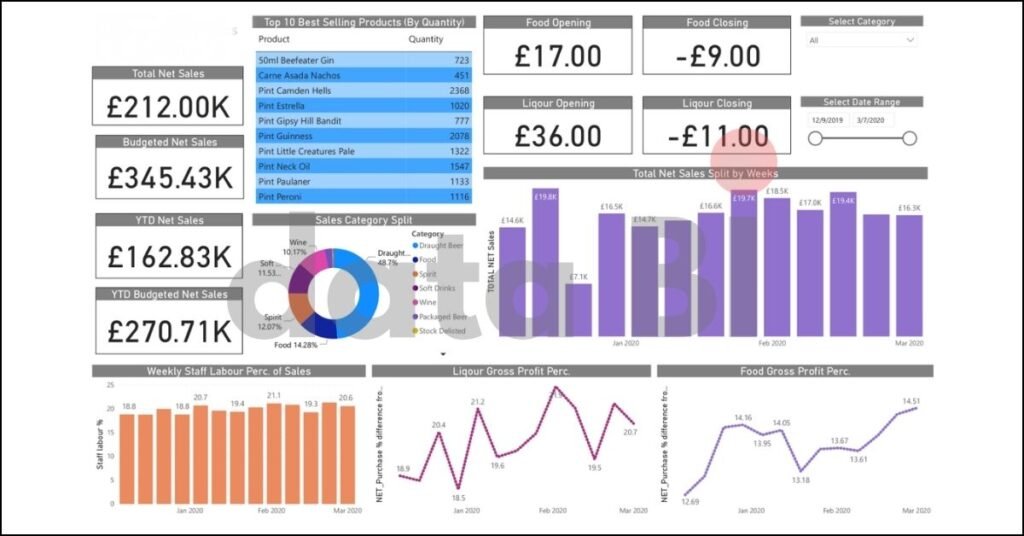
Our Sales Data Analytics Dashboard is designed to provide organizations with a comprehensive view of their sales performance. It focuses on essential key performance indicators (KPIs) that offer valuable insights into sales effectiveness. Here are the primary KPIs featured on our dashboard:
Total Net Sales: Stay informed about the overall revenue generated by your organization.
Budgeted Net Sales: Compare your actual sales to the budgeted sales to measure performance against goals.
Year-to-Date (YTD) Net Sales: Monitor your sales performance for the current year to identify trends.
YTD Budgeted Net Sales: Compare your year-to-date sales to the budgeted figures, helping you stay on track.
Top 10 Best-Selling Products by Quantity: Identify your best-selling products to focus resources on high performers.
Sales by Category (Donut Chart): Visualize your sales distribution by category for a holistic view of your product lineup.
Total Net Sales Split by Weeks: A bar graph breaks down net sales by weeks, allowing you to identify sales trends over time.
Weekly Staff Labor Price: Monitor labor costs on a weekly basis to optimize staffing.
Liquor Gross Profit Percentage: Measure the profitability of your liquor sales.
Food Gross Profit Percentage: Gauge the profitability of your food sales.
Interactive Insights for Informed Decisions
What sets our Sales Data Analytics Dashboard apart is its interactivity. We\’ve incorporated dynamic features that empower users to explore data and gain valuable insights:
Category Filter: Customize the dashboard by selecting a specific product category to view detailed information and trends.
Date Range Filter: Track sales performance trends over time by adjusting the date range.
Visualizing Sales Performance
Our Power BI dashboard leverages the power of data visualization to make sales performance analysis effortless. Here are some of the visual elements that enhance your data exploration:
Donut Chart: The donut chart provides a visual representation of sales distribution by category, making it easy to identify areas of strength and potential growth.
Bar Graph: A bar graph visually represents total net sales split by weeks, allowing you to pinpoint sales trends over time.
Empowering Sales Success
In a competitive market, data-driven decision-making is the key to sales success. Our Sales Data Analytics Dashboard with Power BI empowers organizations to analyze sales performance, identify opportunities, and make informed decisions that drive revenue growth.
Why Choose Our Sales Data Analytics Dashboard?
Data Accuracy: We prioritize data integrity, ensuring that the information you rely on is accurate and reliable.
User-Friendly Interface: The dashboard\’s intuitive design makes it accessible to users across your organization.
Customization: Tailor the dashboard to specific product categories and date ranges for a personalized analysis.
Real-Time Insights: Access the most up-to-date information to make informed sales decisions.
For organizations dedicated to optimizing sales performance and achieving revenue growth, our Sales Data Analytics Dashboard with Power BI is an indispensable tool. Harness the power of data, make informed decisions, and pave the way for sales success.
Explore our Sales Data Analytics Dashboard today and elevate your sales strategy to new heights.