In the dynamic world of sales, understanding and optimizing performance metrics is the key to success. We are excited to introduce our latest tool – the Sales Performance Metrics Analysis Report Dashboard. This powerful resource empowers organizations to delve deep into their sales data, track key performance indicators, and make informed decisions to drive growth.
Elevating Sales Insights
Imagine having a single dashboard that compiles all your critical sales metrics, providing a comprehensive view of your sales performance. The Sales Performance Metrics Analysis Report Dashboard does just that and more.
Key Performance Indicators (KPIs)
This dynamic dashboard offers a rich set of KPIs, enabling you to gain valuable insights into your sales data:
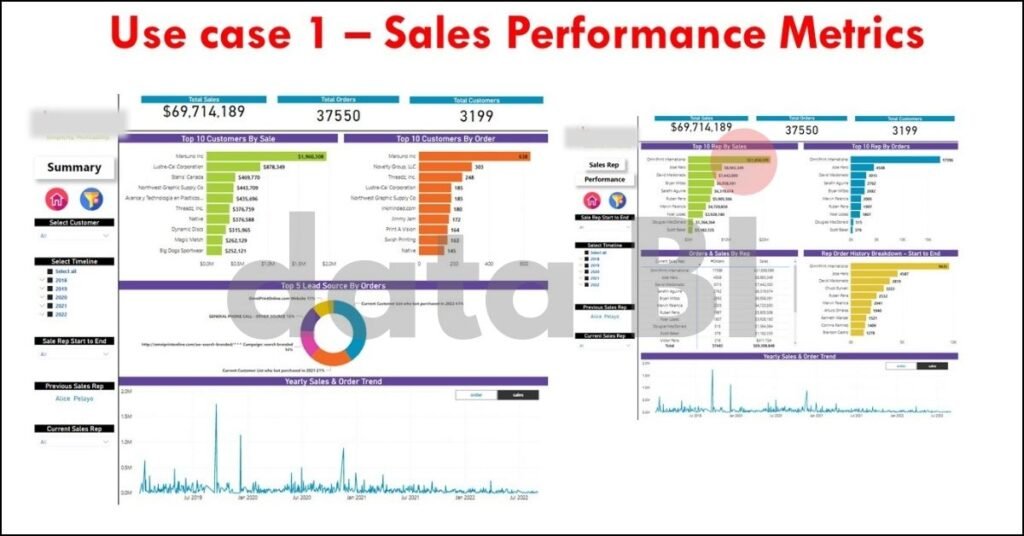
Total Sales: Monitor revenue generated from sales.
Total Orders: Keep track of the number of orders processed.
Total Customers: Analyze the customer base and its growth.
Top 10 Customers by Sales: Identify the top revenue-generating customers.
Top 10 Customers by Order: Recognize the top order-contributing customers.
Top 5 Lead Sources by Orders: Discover the most effective lead sources.
Yearly Sales and Order Trend: Visualize sales and order trends over time.
Top 10 Reps by Sales: Acknowledge the highest-performing sales representatives.
Top 10 Reps by Orders: Celebrate top-order-achieving sales representatives.
Order and Sale by Rep: Analyze sales and order performance by a representative.
Rep Order History Breakdown Start to End: Understand the evolution of sales orders over time.
Yearly Sales and Order Trend: Track sales and order trends year by year.
Empowering Informed Sales Decisions
The Sales Performance Metrics Analysis Report Dashboard empowers organizations to make data-driven decisions across the sales spectrum. Here\’s how it works:
Total Sales, Total Orders, and Total Customers: Gauge overall sales performance.
Top 10 Customers by Sales and Top 10 Customers by Order: Nurture relationships with top clients.
Top 5 Lead Sources by Orders: Optimize lead generation efforts.
Yearly Sales and Order Trend: Plan strategies based on historical trends.
Top 10 Reps by Sales and Top 10 Reps by Orders: Recognize and reward top performers.
Order and Sale by Rep: Assess individual sales representative performance.
Rep Order History Breakdown Start to End: Visualize sales evolution over time.
Interactive Filters for Tailored Analysis
One of the standout features of this dashboard is its interactivity. Customize your analysis by filtering data based on:
Select Customer: Focus on specific customer profiles.
Select Timeline: Analyze data within specific time periods.
Sales Rep Start to End: Track sales representative performance over time.
Previous Sales Rep and Current Sales Rep: Compare and contrast sales representative performance.
Mastering Sales Insights
The Sales Performance Metrics Analysis Report Dashboard serves as your compass, guiding you through the intricacies of sales metrics. Whether you\’re a sales manager, team lead, or a business leader, this tool equips you with the insights needed to drive sales growth.
Conclusion
In a world where sales excellence is the key to success, the Sales Performance Metrics Analysis Report Dashboard becomes your strategic ally. It streamlines sales data management, empowers data-driven decisions, and ultimately leads your organization to new heights of success.
Stay tuned for more updates and insights from our suite of data analysis tools. The future of sales growth is here, and it\’s powered by data.